About the Model
How to use the Model
Beat the House AI is a sports betting tool designed to use your knowledge and skill in combination with cutting edge AI to beat the house. We crunch the numbers, you make the picks.
The Model Inclination indicates which side of the bet the AI favors.
Probability and Expected Value indicate how much confidence the AI has in that bet.
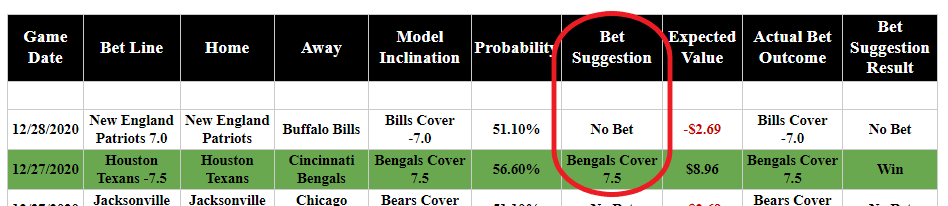
Bet Suggestions are the 10% of bets the AI is most confident about.
Betting and Table Basics
There are 3 main bet types.
Bet Types:
Over-Under: Whether the total points scored in a game will be over or under a particular value.
Spread: Whether the margin of victory will be over or under a particular value.
Player Props: Whether a particular player will have over or under a particular value in a statistical field.
Each row of the tables represents a particular bet. Each row will indicate the teams and date for the game.

Along with an updated Bet Line for the game. The Bet Line indicates the Odds that the model used to create the prediction. If the odds used by the computer are less favorable than the odds available at your sportsbook, we do not recommend placing a wager. A single point difference in a Spread or Over-Under bet can be as big as a 5-6% change in the probability of the outcome which can result in 10-12% swing in expected value.

The Model Inclination indicates which side of the bet the model favors but does not indicate confidence about the prediction. For instance in the example, the model believes the Bills will win by more than 7 points but it is not confident about the outcome. However, on the next line the model believes the Bengals will lose by less than 7.5 points and is more confident in the outcome.

The Probability gives the percent chance of the Model Inclination occurring. For example, the model thinks the Bills will cover 51.1% of the time.

The Bet Suggestion indicates what action the model believes is best. “No Bet” means the best action is not to place a wager. Green rows indicate where a Bet Suggestion is not “No Bet.” The Bet Suggestions are created through a combination of thresholds that maximize expected value and minimize season long variance. The thresholds we use are quite high so not all positive expected value bets are suggested. You will notice that a majority of bets have negative expected value, this means the model believes the bet is “priced” correctly and that no side of the bet is favorable.
Expected Value is the expected return from a $100 bet. Vigs of -110 are assumed for all over-under and spread bets. For the player props the vig will be indicated with its own column.

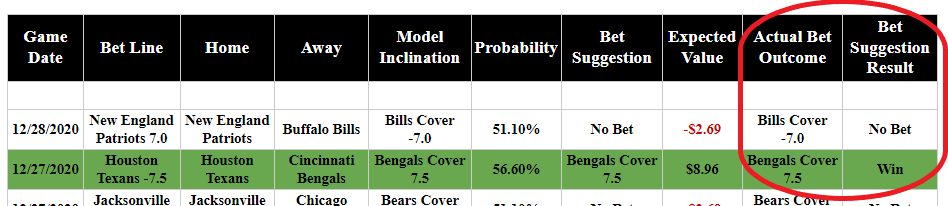
If the game has already been played, the Actual Bet Outcome will indicate the in game bet outcome. The Bet Suggestion Result will indicate whether the Bet suggestion won or lost. If the game has not been played, these columns will have a “-”.
Methodology
To create the training data, NFL statistics were collected from the 2015-2019 seasons. The statistics include long and short term statistical data about the teams and players, injury data including many parameters to determine the meaningfulness of the injuries, weather data, referee data, travel data, and much more. The final NFL data set for over-under predictions contained over 12,000 features. After creating the large data sets, we separated the data into 5-7 smaller data sets depending on the model. We intentionally separated the data so that each smaller data set contained unrelated features. We also generated 3 different target variables for each bet type. Our goal in curating the data was to generate multiple data sets and target variables to approach the problem from different angles.
Each model is a collection of 10 to 15 models. For the “sub-models” we used a variety of different techniques including XGBoost, MLP Neural Networks, LSTM Neural Networks, Random Forrest, Elastic Net, and many more. The sub-models vary in the model structure, variables used, and the targets they predict. Our aim was to have many high performing models approaching the problem in uncorrelated ways. Thus, the models will perform better when their predictions are used in combination. For example, if a model using referee data predicts “Under” and a model using in game statistical trends also predicts “Under” then the outcomes are synergistic. Opposed to two models using highly correlated data and both predicting “Under” is statistically less reliable. Finally, we aggregate the predictions from the “sub-models” to make the final predictions. We used the 2012-2014 seasons as well as the 2020 season to validate and create thresholds for our Bet Suggestions.
Bet Tracking and Predictions
All lines and predictions are continually updated through out the day to account for changes to weather and injury data. One hour before the game starts we lock in our Bet Suggestions, these are the Bet Suggestions that are recorded. Over-Under and Spread bets are fairly uniform across sportsbooks and lines are easy to find. Player Props can be more challenging as lines move quickly and can have large differences between sportsbooks. We make every effort to insure that the lines we have posted are available at major sportsbooks. We strongly recommend line shopping for all bet types, getting the best price for bets can create much larger returns in the long run.
Please feel free to contact us with any questions, concerns, or suggestions.